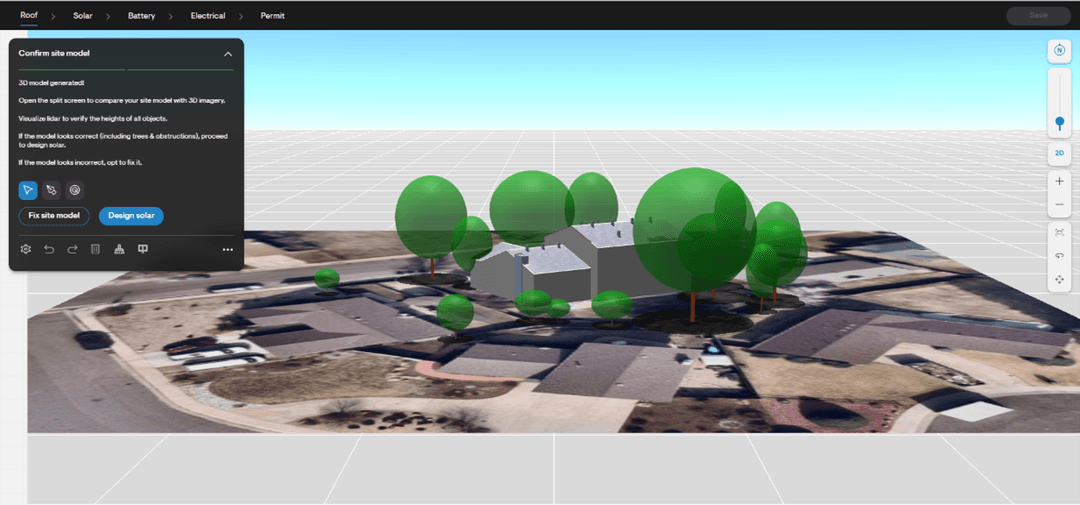
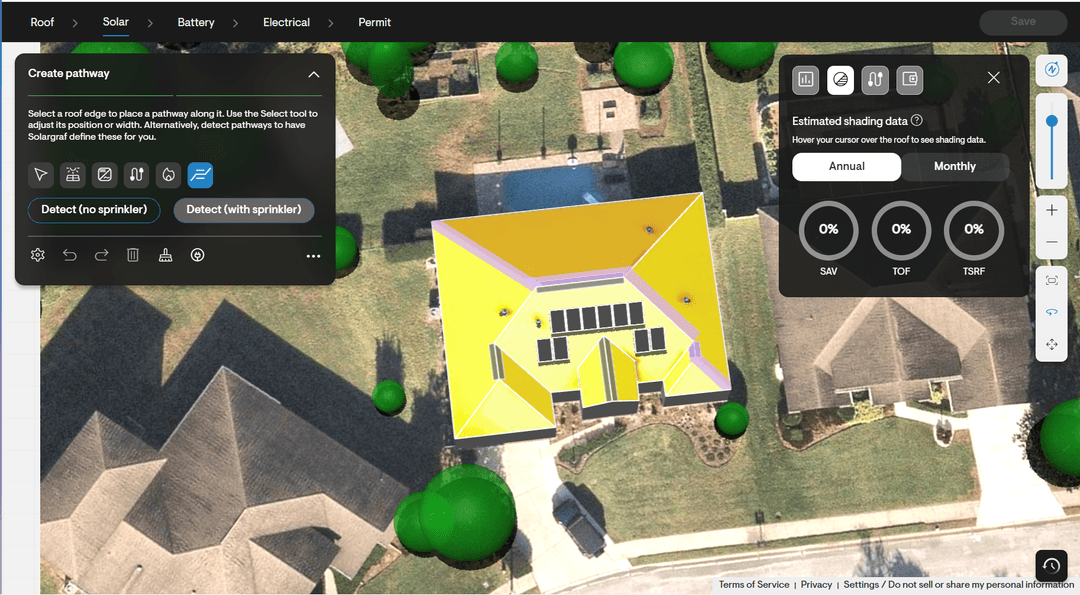
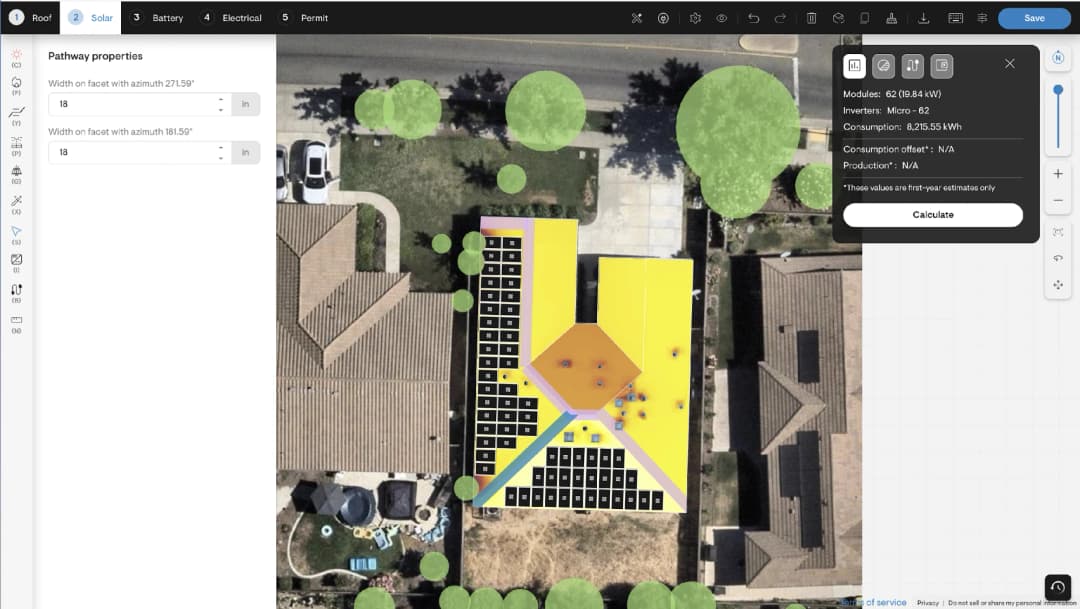
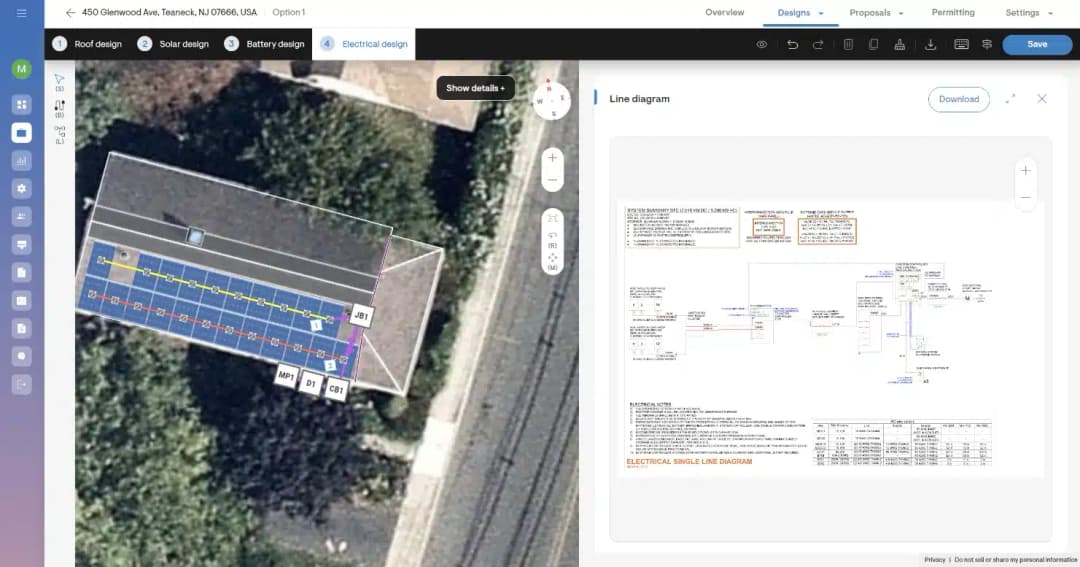
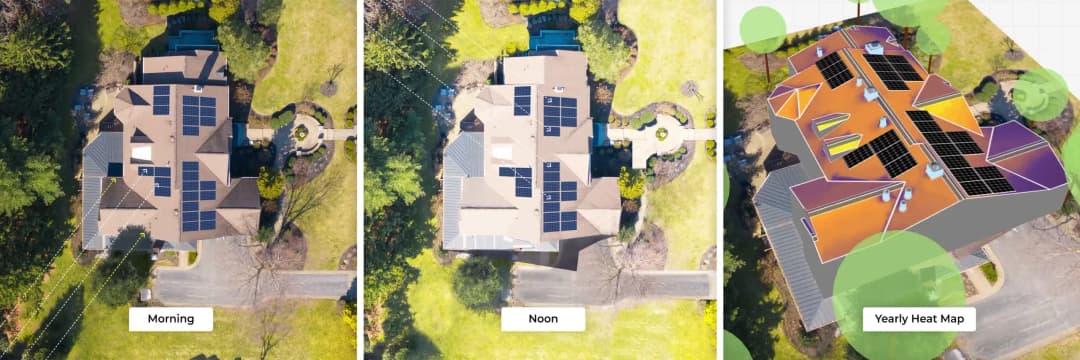
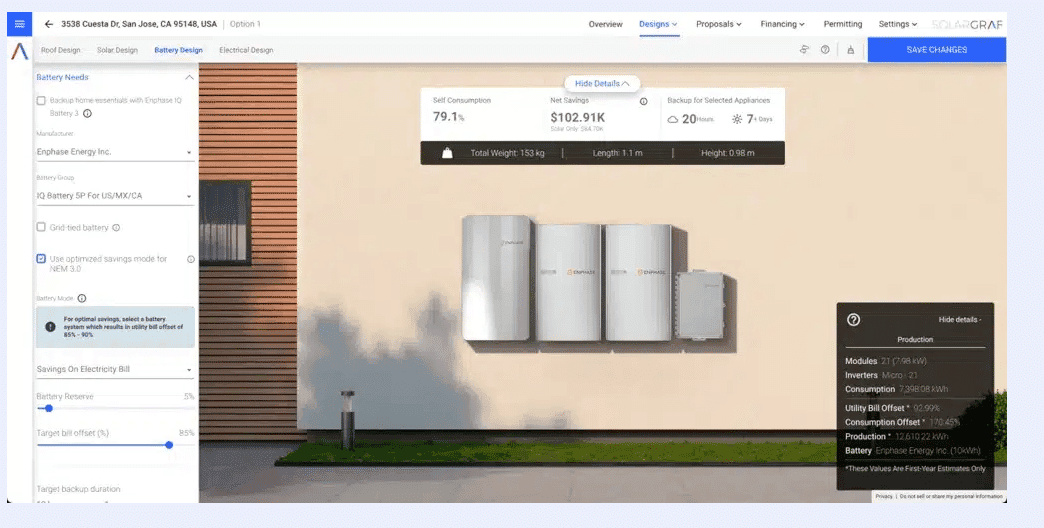
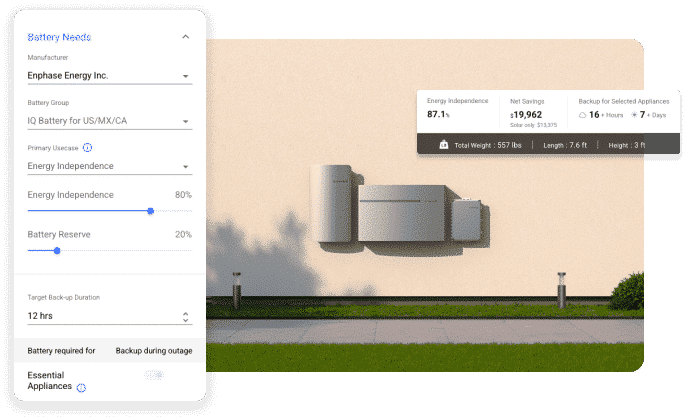
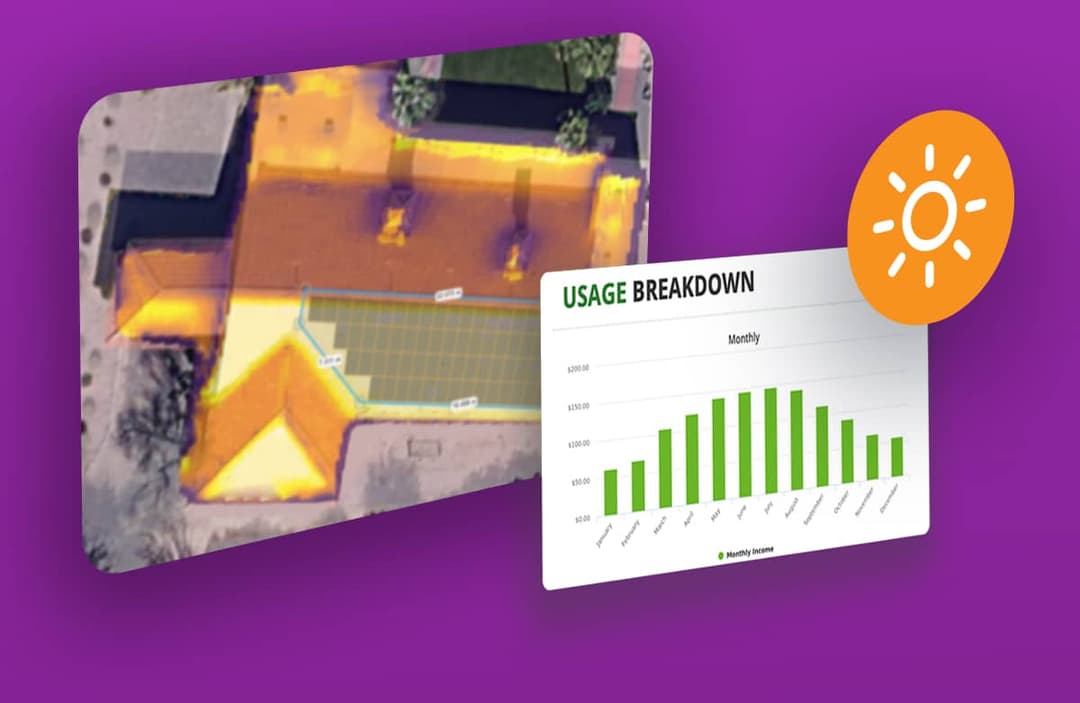
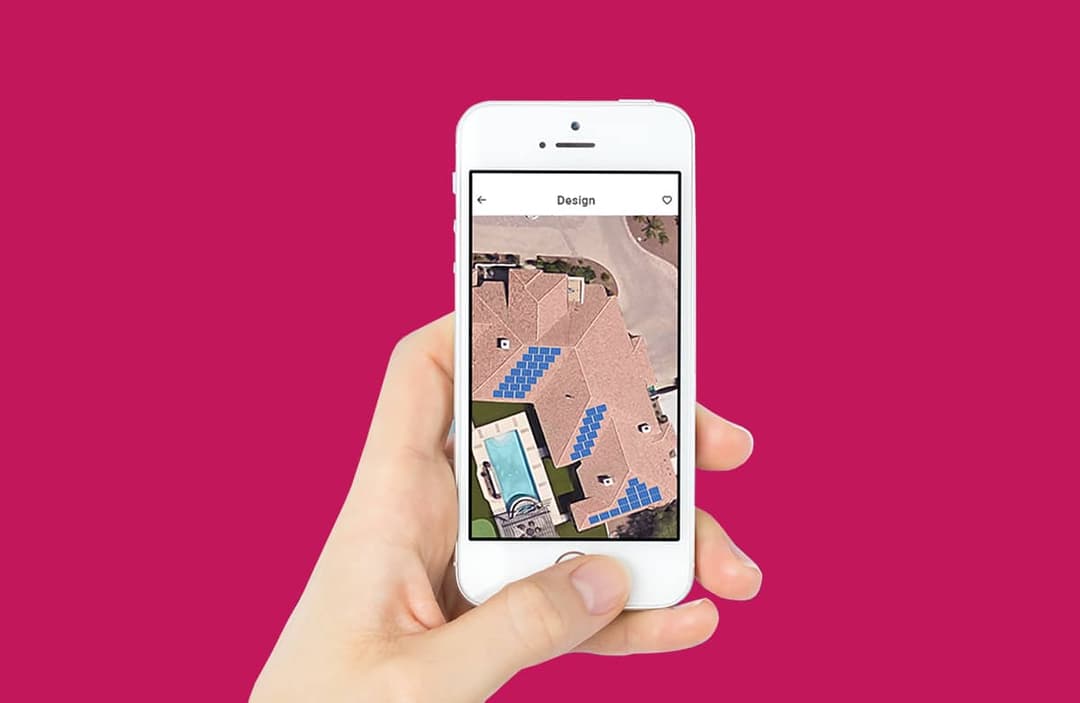
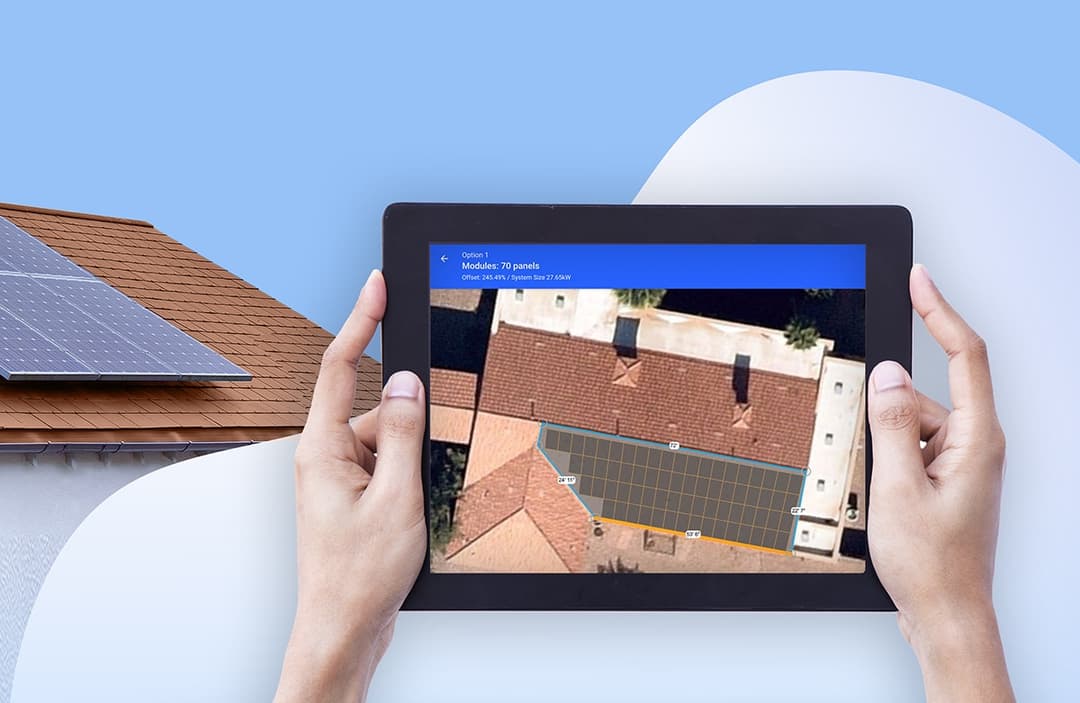
The power of Solargraf lies in its proprietary shading engine, which simulates the sun’s path at each hour of the day throughout the year and leverages site-level weather data to calculate irradiance and Solar Access Values (SAVs) for each point on the 3D model. These values, combined with system losses, are then used to obtain production estimates for solar modules placed on the roof, eliminating the need for time-consuming site visits.
Solargraf’s shading analysis is verified by NREL and NYSERDA and you can read our comprehensive blog on NREL’s shading comparison. In addition to the verification, we compared on-tool shading calculation with on-site shading using SunEye 210 shade measurement tool.
SunEye
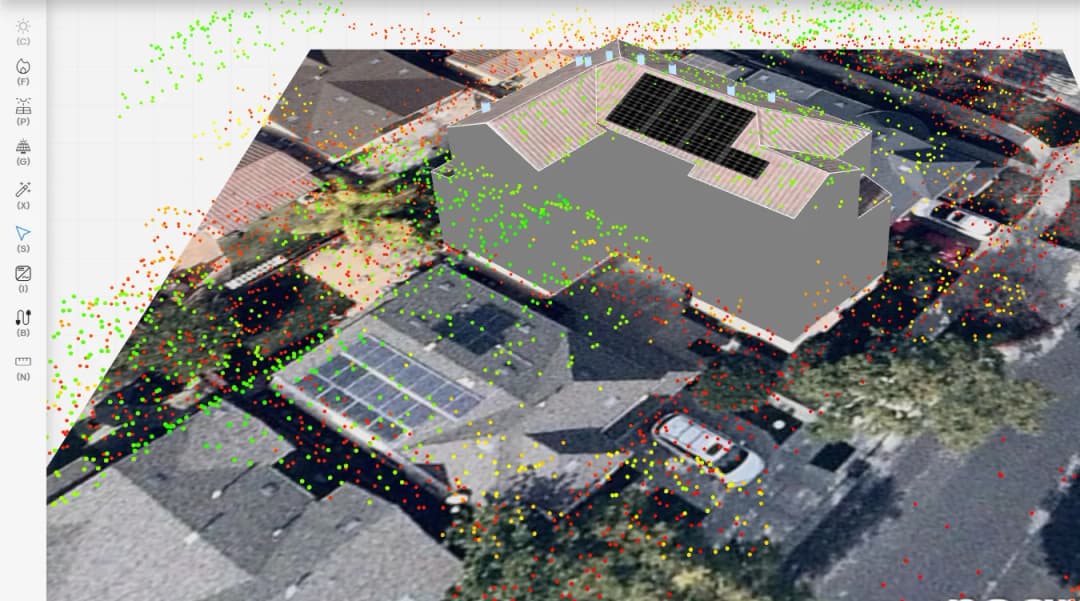
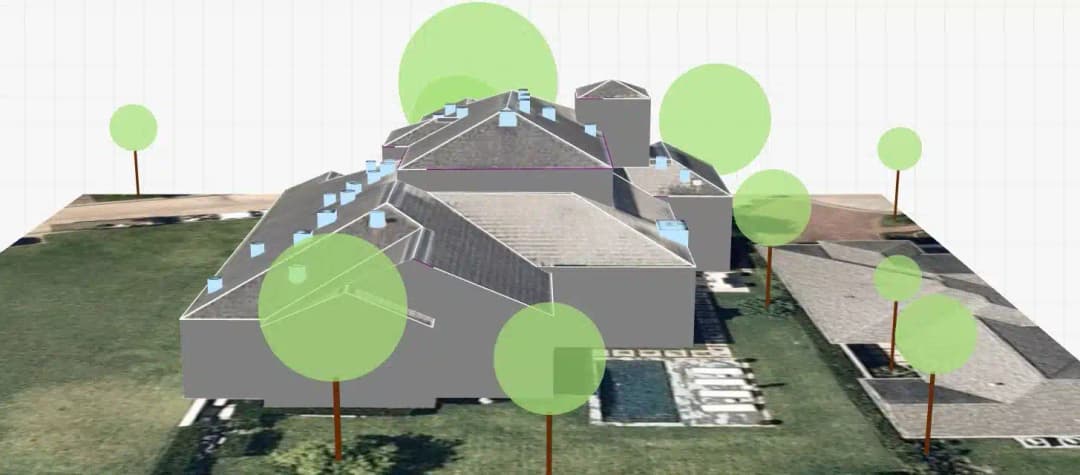
SunEye Data represents the actual (ground truth) SAV captured using the Solmetric SunEye 210 device. This device uses a fish-eye camera to capture the skyline and employs image processing to detect open sky and shading-causing obstructions. By combining the skyline information with the Sun-Path—based on the site’s latitude, longitude, and the surface’s tilt and azimuth—the device generates SAV values at yearly, monthly, hourly, and quarter-hourly levels.
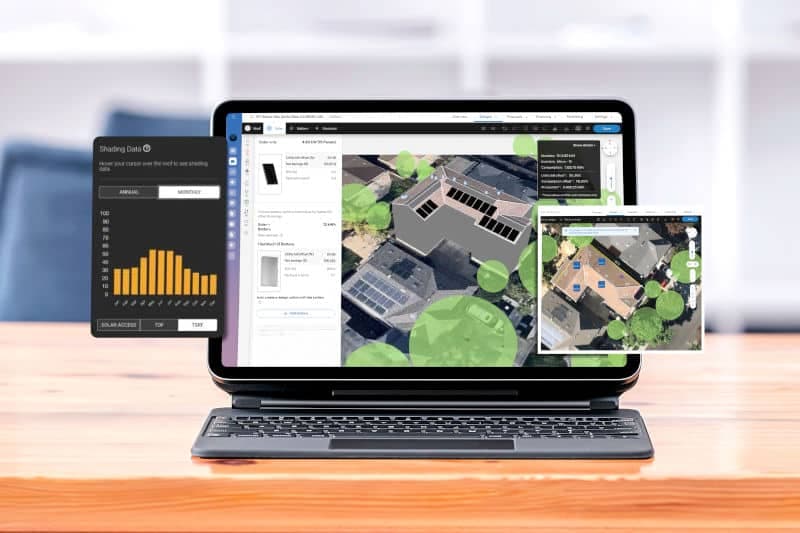
Typically, a site has multiple evaluation points (and corresponding skylines) for which SAV is assessed. A SunEye report includes all the points where evaluation is conducted, along with their locations on a site map. Each evaluation point is accompanied by a fish-eye image, the Sun-Path, and monthly and yearly SAV, TOF, and TSRF data. For capturing corresponding SolarGraf values, the locations from the sitemap are used as reference points.
Shading comparison
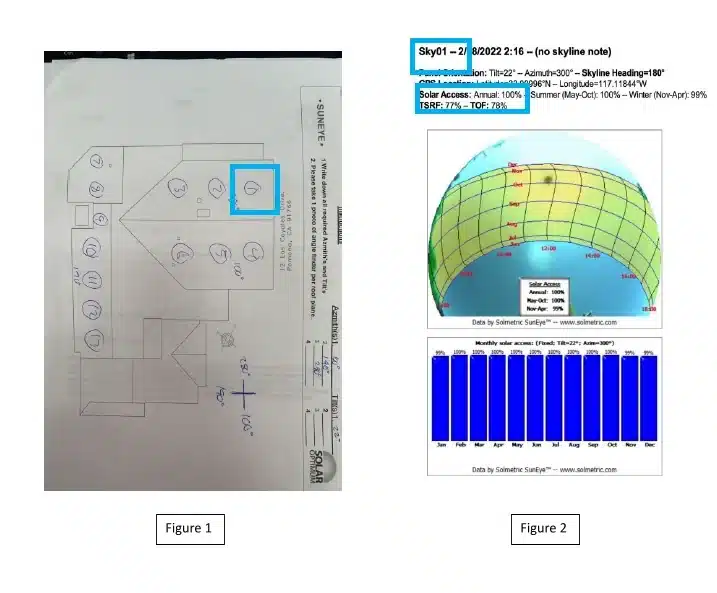
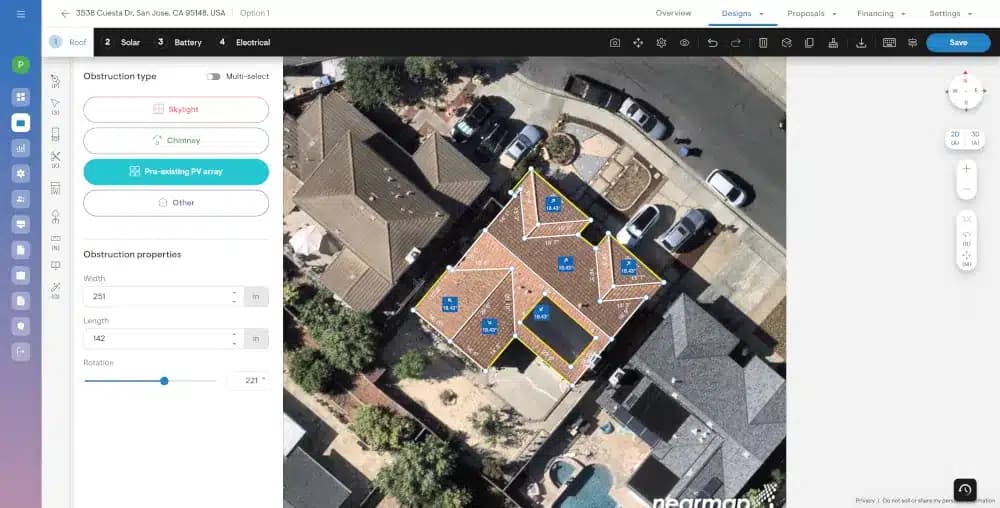
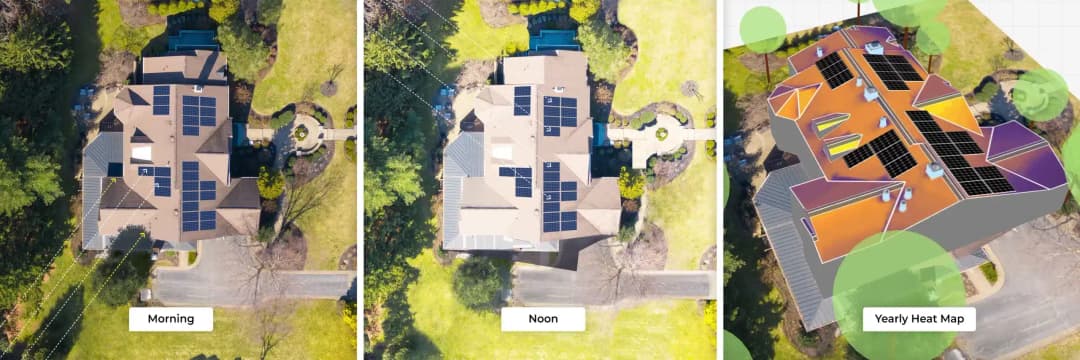
Figure 1 shows a sample site with an on-site shading evaluation for access point 1 on the roof, highlighted in blue.
Figure 2 shows the SunEye shading measurements for the same access point in blue.
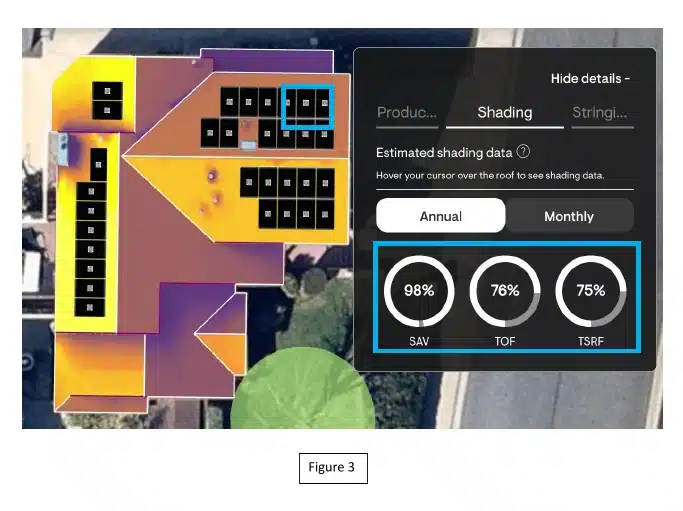
Figure 3 captures the shading calculation of the same access point using Solargraf. It shows that the annual SAV, TOF, TSRF values are similar to the ground truth (SunEye data).
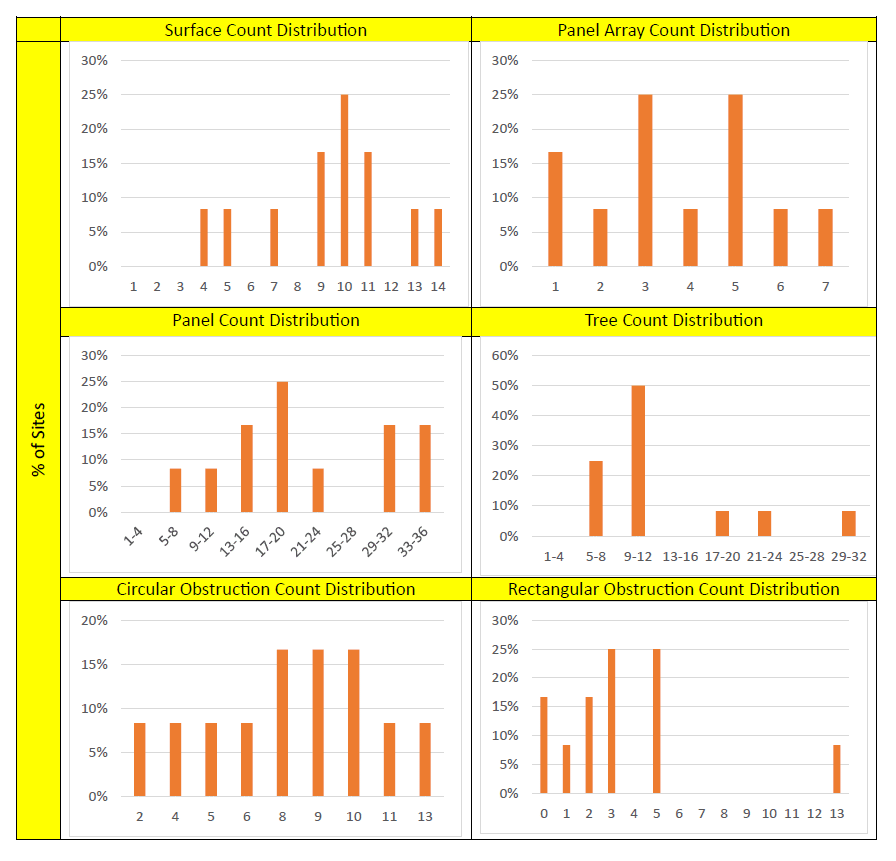
Access point distribution:
Solargraf also analyzed 96 total access points on rooftops, featuring a variety of slopes, rooftop obstructions, surrounding trees, and other factors that affect rooftop SAVs, for 12 residential sites. We then compared the SunEye 210 on-site shading data to Solargraf’s on-tool calculation.
The table below shows the differences in the SAVs estimated by Solargraf and the SunEye on-site measurements.
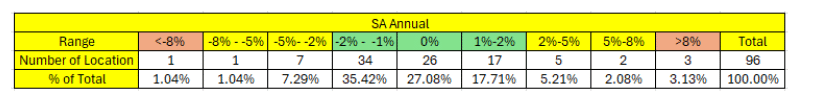
The result of the analysis shows that annual SAVs provided by the Solargraf were statistically equivalent within +-2 SAVs for 80% of the access points.
Conclusion
Solargraf stands out as a cutting-edge tool for accurate shading calculation, saving valuable time and resources by eliminating the need to collect on-site shading measurements. By leveraging advanced algorithms and precise data integration, Solargraf ensures that your solar designs are optimized for maximum efficiency and performance.
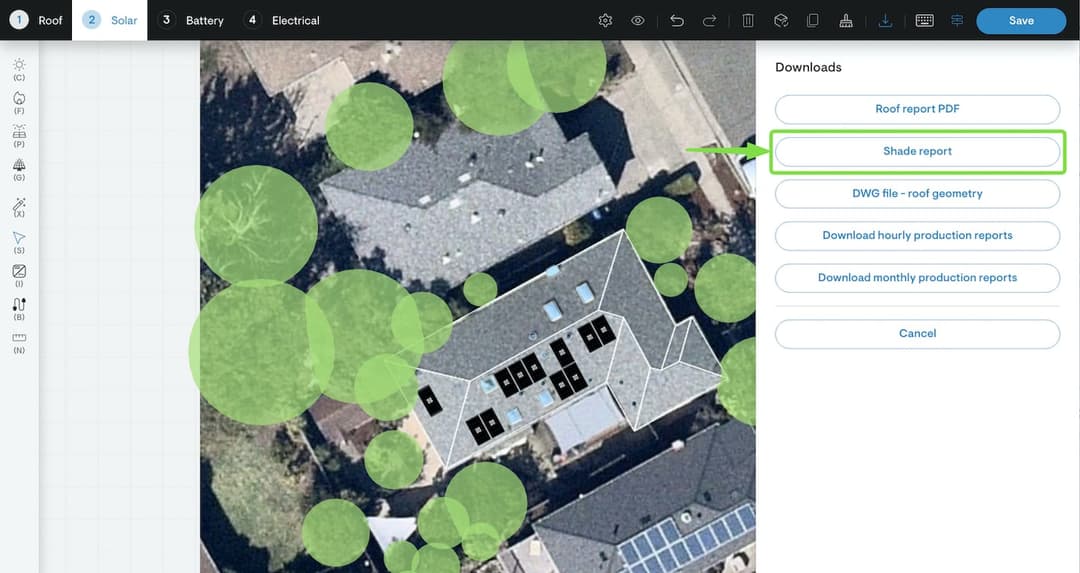
Experience the future of solar design with our innovative shading analysis capabilities. Get started today and see the difference for yourself!